I'd already spent a lot of time with Formula 1 data for my race predictor, so this felt like a natural next step. But it's the opposite kind of project. The predictor looks forward and asks who will win on Sunday. This one looks back at a single career and asks what it actually looked like, race by race, without the hype in either direction.
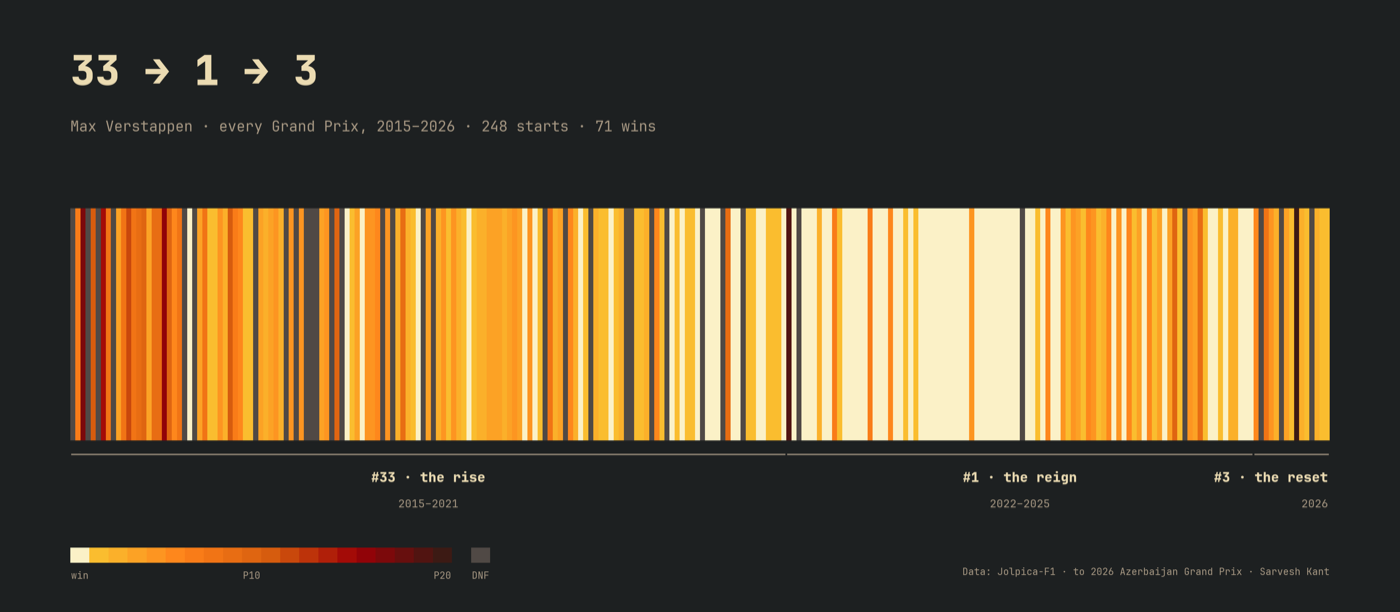
The title comes from his car numbers. He raced as #33 from 2015 to 2021, switched to #1 as reigning champion from 2022 to 2025, and runs #3 in 2026. That turned out to be a nice way to split the story: the rise, the reign, and whatever this season is.
How it works
Two data sources, and they're very different things:
- Jolpica-F1 (the community successor to the old Ergast API) is the results record: grid, finish, status, points, qualifying times, standings. It goes back to 1950, so it covers his whole career and also the careers of Schumacher, Senna and the rest.
- FastF1 reads Formula 1's live-timing feed: every lap, tyre compound, safety car periods, telemetry. That data only exists from 2018, so anything lap-based starts there.
Everything is Python: pandas for the tables, Plotly for the charts, matplotlib for the poster. The chart colours come straight from this website's stylesheet, with Max in orange everywhere and everyone else in gray, so the eye goes where the story is.
Before drawing anything I wanted to know the numbers were right, so the first notebook compares my totals against the official record. Starts, wins, podiums, titles and career points all match exactly, including the points (3607.5), which only works if sprints, bonus points and half-points races are all handled properly. The one thing that didn't match was poles: my data has him fastest in qualifying 51 times against an official 48. The gap comes from grid penalties and the odd 2021 sprint weekends, where pole went to the sprint winner, and record-keepers don't agree on how to count those. So I count "fastest qualifier" instead and say so.
A few rules that matter more than they look
Sprints are stored separately and never count as wins. A retirement isn't "lost 15 places", it's a missing value. And every number on this page comes out of the pipeline into one file, so nothing here was typed in by hand.
What the data says
The whole career in one picture
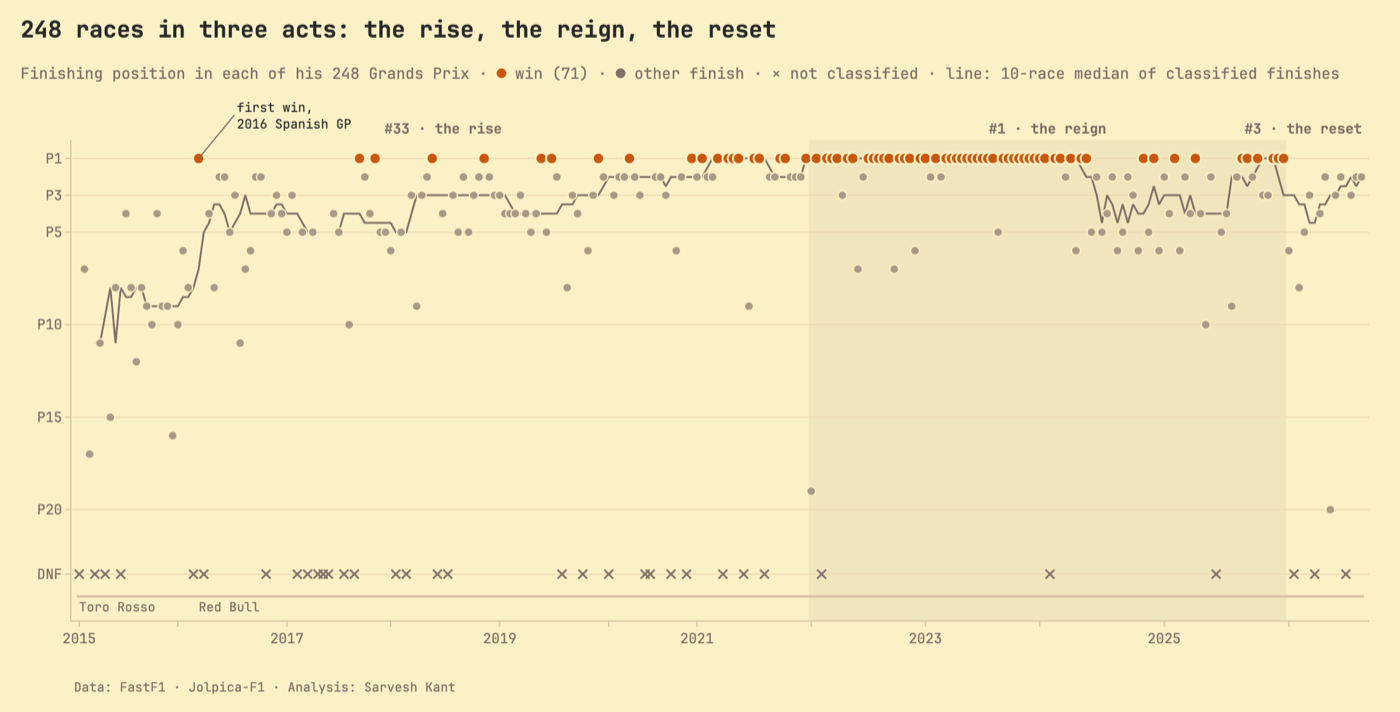
Midfield, then podiums, then a long solid bar of wins, then podiums again. The shape is so clear that this is the chart I'd show if I could only show one.
Four titles, two of them on a knife-edge
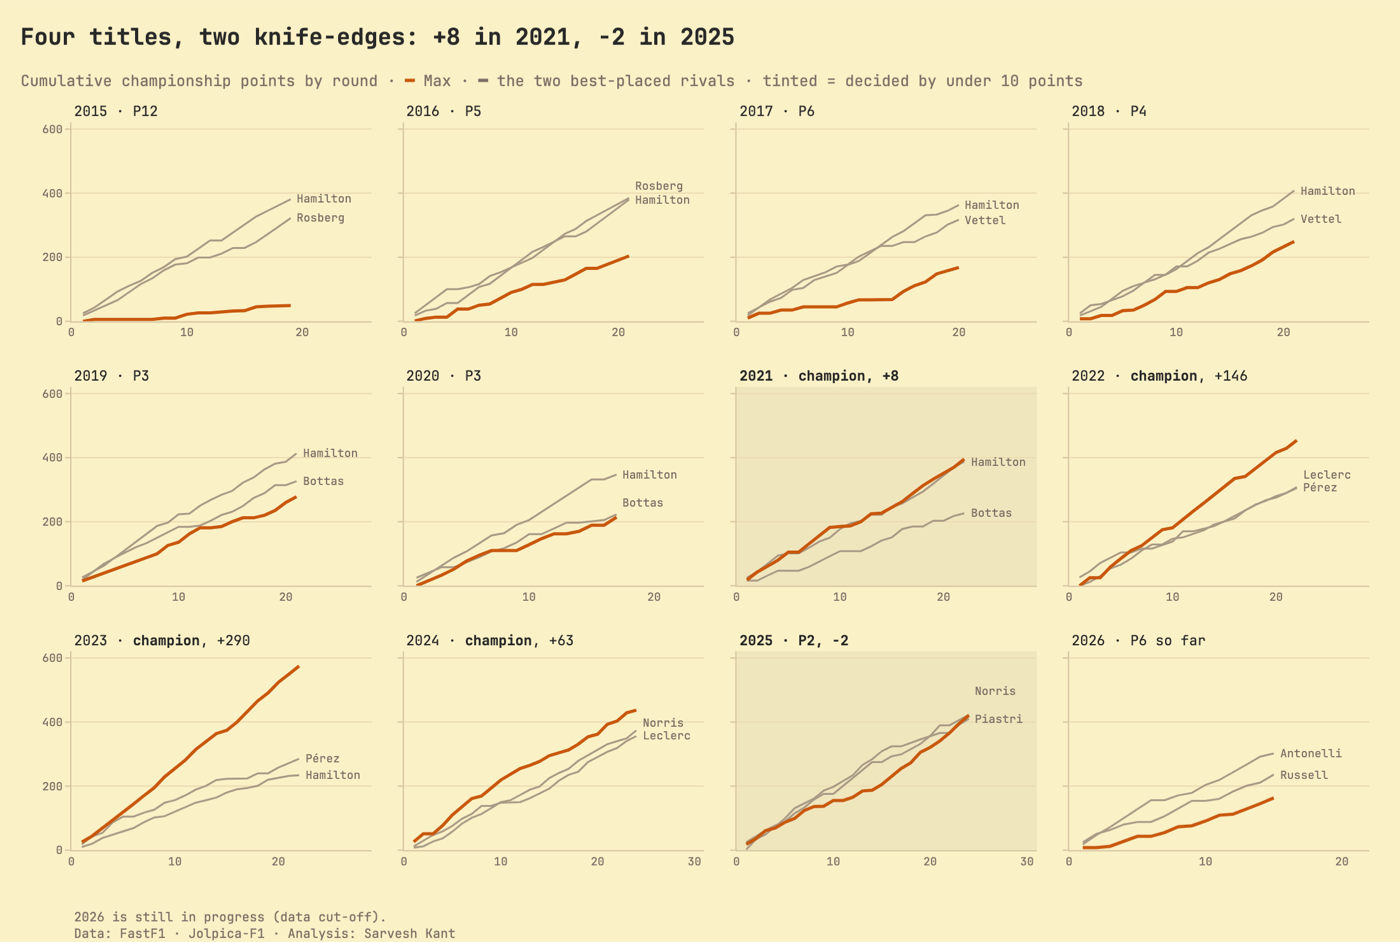
2021 went his way by 8 points over Hamilton. 2025 went the other way: he finished 2 points behind Norris. That second one barely features when people talk about "the reign", but it's right there in the data. And in between, 2023 is almost silly: he won 19 of 22 races.
Among the greats
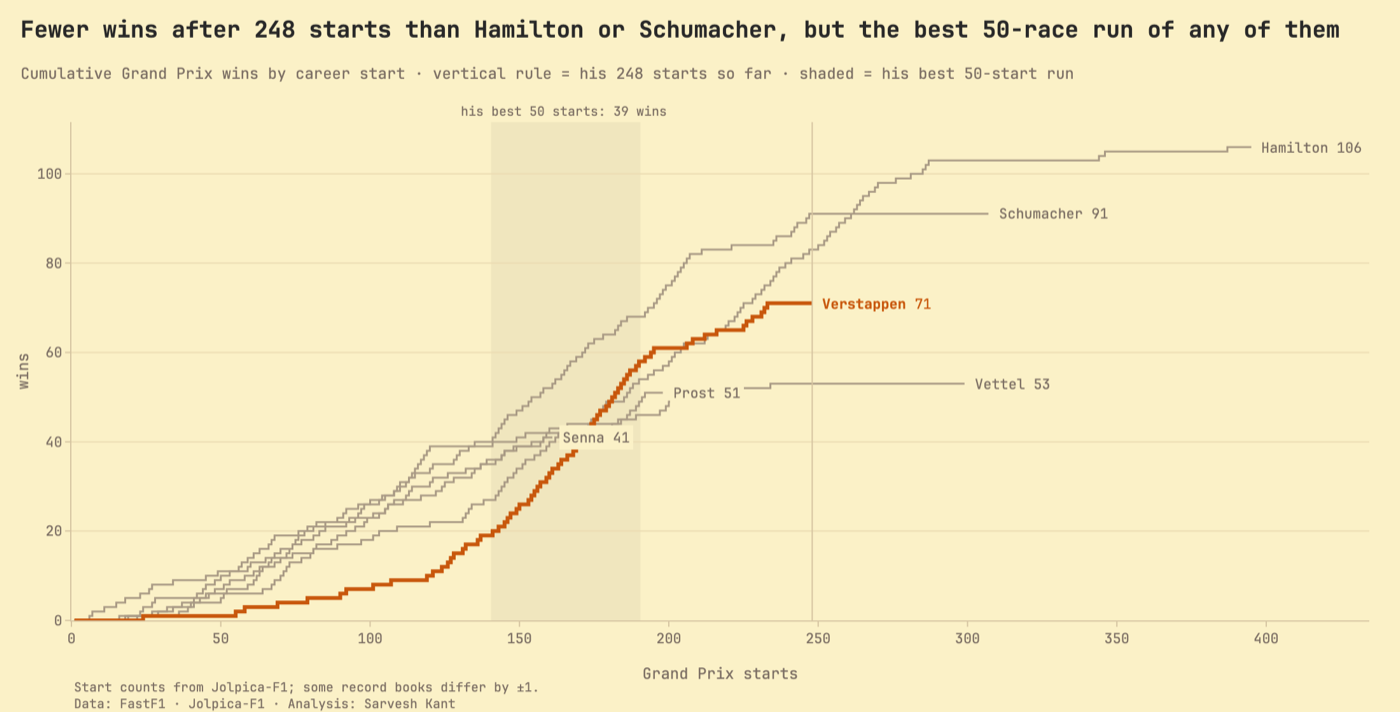
This one surprised me. Comparing by career start rather than by year, after 248 starts Schumacher had 91 wins and Hamilton had 83. He has 71. So the "most dominant ever" line doesn't hold up on wins per start. What does hold up is the peak: his best run of 50 starts had 39 wins, against 31 for both Hamilton and Schumacher. Nobody on this chart has had a stretch like it.
Anatomy of one race: São Paulo 2024
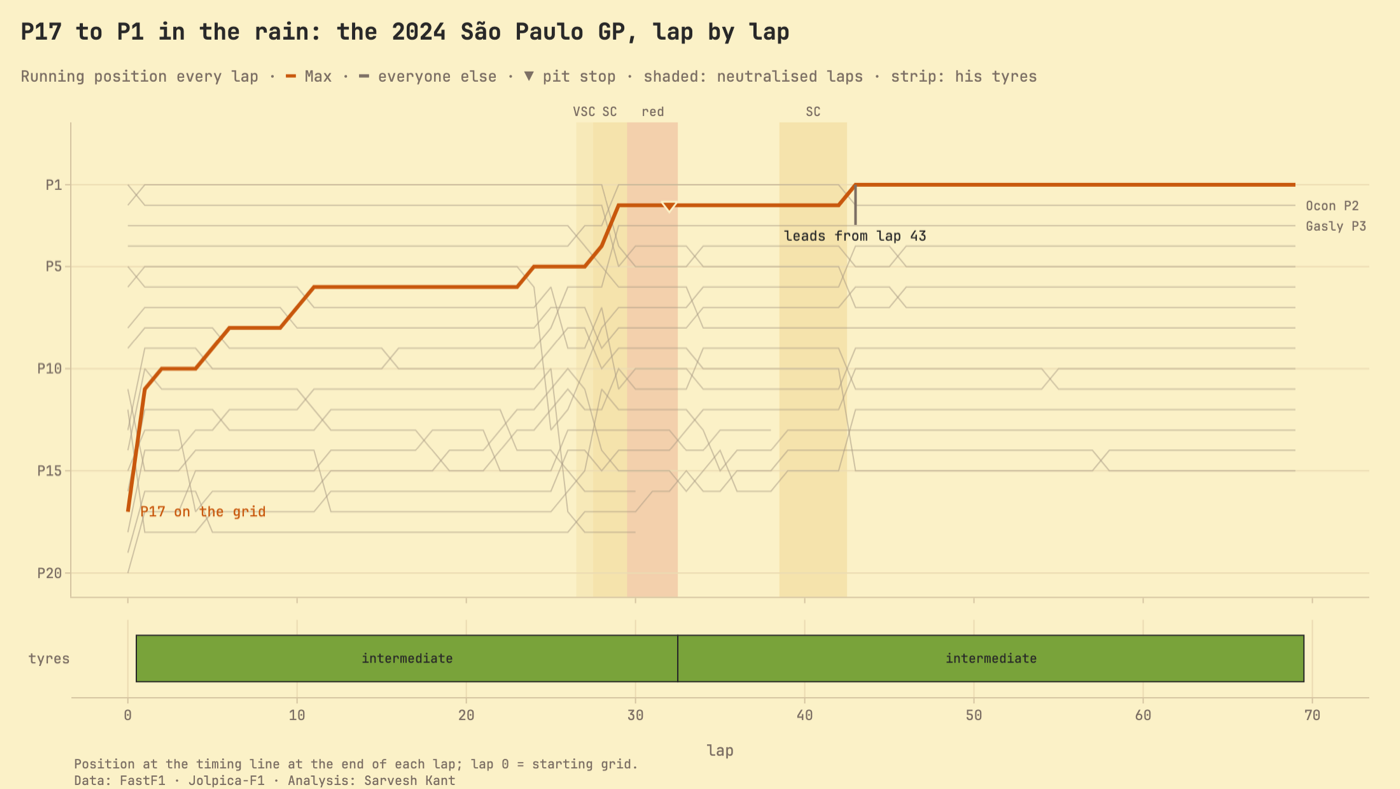
He started 17th in the rain and was already 11th after one lap. He made his only stop while the race was red-flagged, took the lead on lap 43 and kept it to the end of 69 laps, on intermediates the whole way. I picked this race because the position chart makes the climb visible in a way a results table never could.
#3: the reset
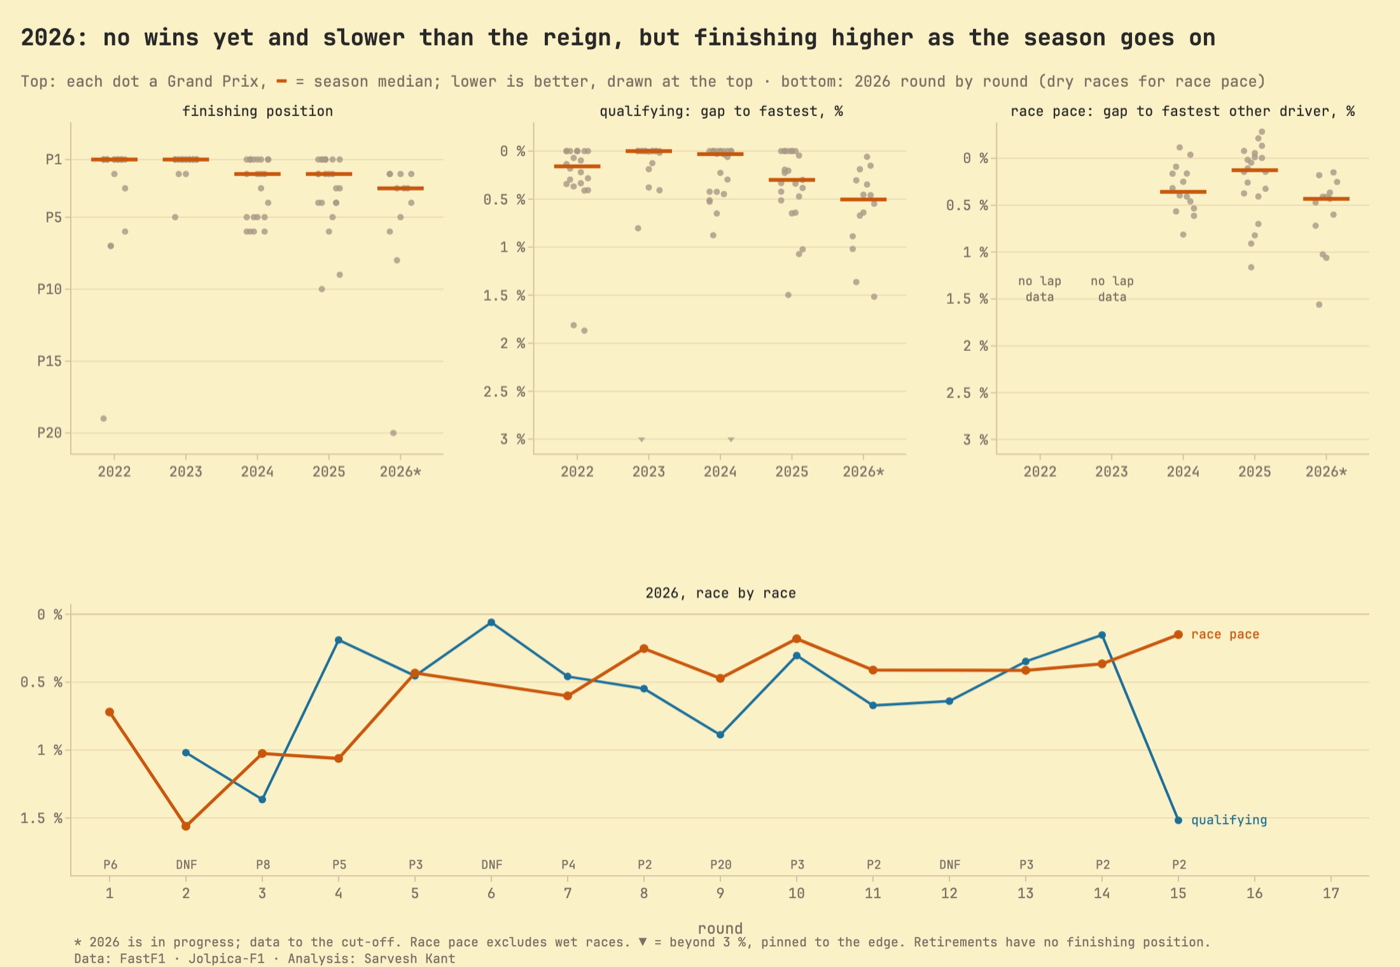
The new rules haven't been kind so far. After 15 races he has no wins, 7 podiums and sits 6th in the championship. His median qualifying gap to the fastest qualifier is 0.50%, where in 2023 it was zero. But the second half of the season looks better than the first, and his last three finishes were P3, P2, P2. This is the one chapter that keeps changing: one command pulls the new race and rebuilds every chart.
Things I got wrong along the way
- Winning margin is a bad measure of dominance. My first idea was the gap to second place. But his median winning margin in 2023 was smaller than in 2021, because once you're that far ahead you manage the gap instead of stretching it. I dropped the chart.
- A finished chart that said nothing. I built one for positions gained on lap one, then noticed it mostly measured where he started (from pole you can only lose places). Cut it.
- A line that lied. My first career timeline counted retirements as P20 in the rolling average, so 2017 looked like a collapse in form. It was retirements, not slow driving. They get their own row now.
- Plotly quietly dropping things. Rows missing from a heatmap because it read the years as numbers, shading that never appeared in a subplot. None of that throws an error. You only catch it by looking at every chart.
Limits worth knowing
Finishing position mixes the driver with the car, so a P5 in a slow car can be a better drive than a win in a fast one. Retirement causes from 2024 on aren't recorded in the data (it just says "Retired"), so those are shown as unknown rather than guessed. And 2026 is half a season.
Data to the 2026 Azerbaijan Grand Prix (round 15, 26 September 2026). Data from Jolpica-F1 and FastF1. This is an unofficial project and isn't associated in any way with Formula 1.